Herbert Smith Freehills is pleased to announce the publication of the tenth edition of the Australian Public Mergers and Acquisitions Report.

This edition examines the 56 control transactions involving Australian targets listed on the ASX that were conducted by way of takeover or scheme of arrangement in the 2018 financial year.
The report provides detailed insight into and analysis of, among other things:
- the structure and key terms of public M&A transactions in FY18; and
- trends and developments in market activity, sectors and M&A deal technology.
An overview of some of the key findings of this year’s report is set out below.
ACTIVITY LEVELS
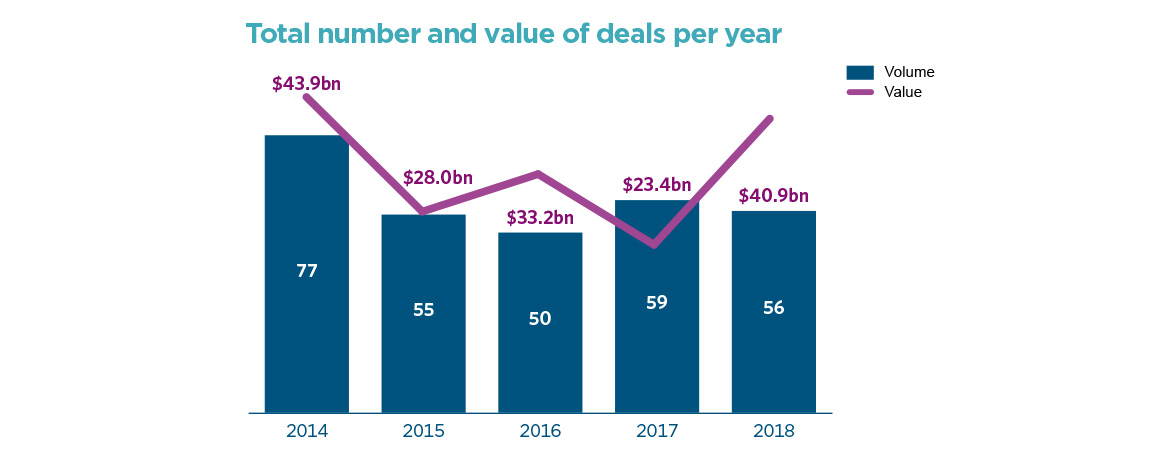
Public M&A activity in FY18 was broadly consistent with the previous three years. There were 56 public M&A deals announced in FY18 compared to 59 deals in FY17, 50 deals in FY16 and 55 deals in FY15. Total deal value increased to $40.9bn, but was just $20.1bn excluding Unibail-Rodamco’s $20.8bn acquisition of Westfield Corporation. Total deal value was $23.4bn in FY17, $33.2bn in FY16 and $28bn in FY15.

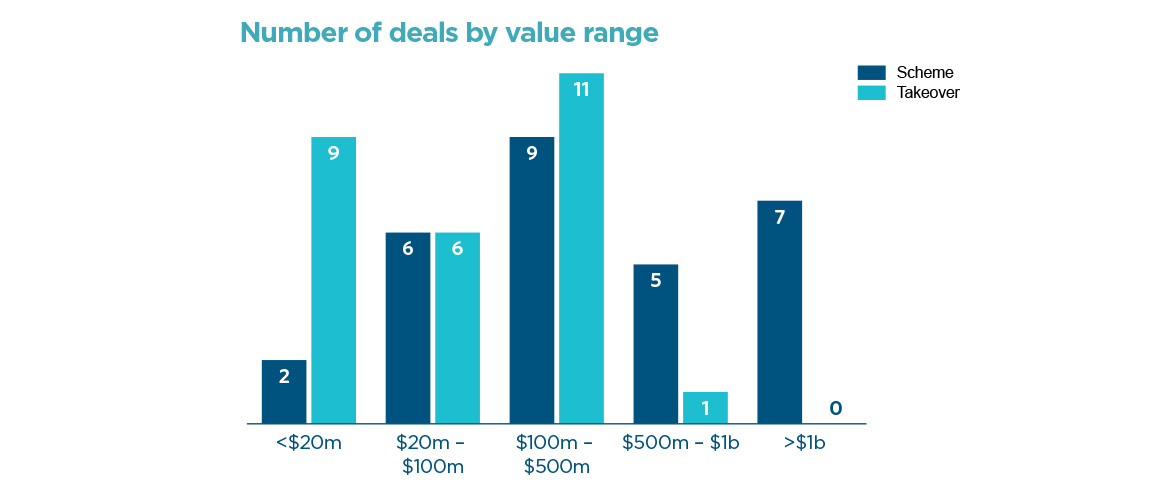
There were 7 mega deals (>$1bn) in FY18 and a substantial number of transactions for targets valued at more than $100 million. The median target value was $179m, up from $54 million in FY17.

SECTOR OVERVIEW
The real estate sector accounted for 60% of deals by value and 11% of deals by number.
Activity in the energy and resources sectors increased, contributing $4.44bn to total deal value and representing 41% of deals by number.
Levels of activity in the health care and information technology sectors were higher than those experienced historically. Deals in the health care sector accounted for 11% of overall deal value and 13% of overall deal volume. Deals in the information technology sector accounted for 4% of deals by value and 9% of deals by number.

ACTIVITY UNDERPINNED BY FOREIGN BIDDERS
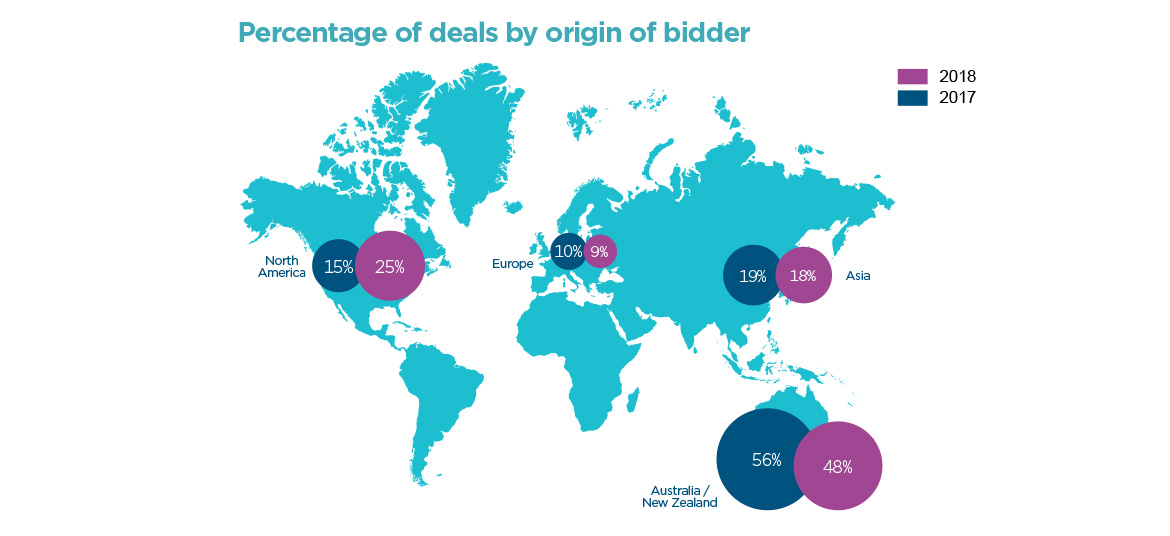
Foreign bidders dominated public M&A activity in FY18. They accounted for 90% ($36.8bn) of total deal value and 52% of bidders by number. North American bidders were the most active, representing 14 of the 29 foreign bids and 22% of total deal value.


Legal Notice
The contents of this publication are for reference purposes only and may not be current as at the date of accessing this publication. They do not constitute legal advice and should not be relied upon as such. Specific legal advice about your specific circumstances should always be sought separately before taking any action based on this publication.
© Herbert Smith Freehills 2024

